S&P 500 Investment Calculator
Estimate how a lump sum or monthly investment in the S&P 500 could grow over time. Adjust your return rate, inflation, contribution schedule, and timeline, then review a year-by-year breakdown.
Why This Calculator Is Different
Clear assumptions, flexible scenarios, easy comparison
Many calculators only show one final number. This tool makes assumptions explicit and shows year-by-year output, so you can verify and compare "what-if" cases before making decisions.
01
Transparent Assumptions
See exactly what drives the result: starting amount, recurring contributions, expected return, inflation, and time horizon. No hidden inputs or black-box logic.
02
Multiple Goal Modes
Switch between Future Value, Required Initial Investment, Required Return Rate, and Time to Goal, so you can solve for the number that matters most.
03
Designed for Long-Term Index Investors
Test different S&P 500 scenarios without switching tools: adjust contributions, returns, inflation, and timeline, then instantly compare results side-by-side.
What You Can Do With This Calculator
An S&P 500 calculator built for practical scenario decisions
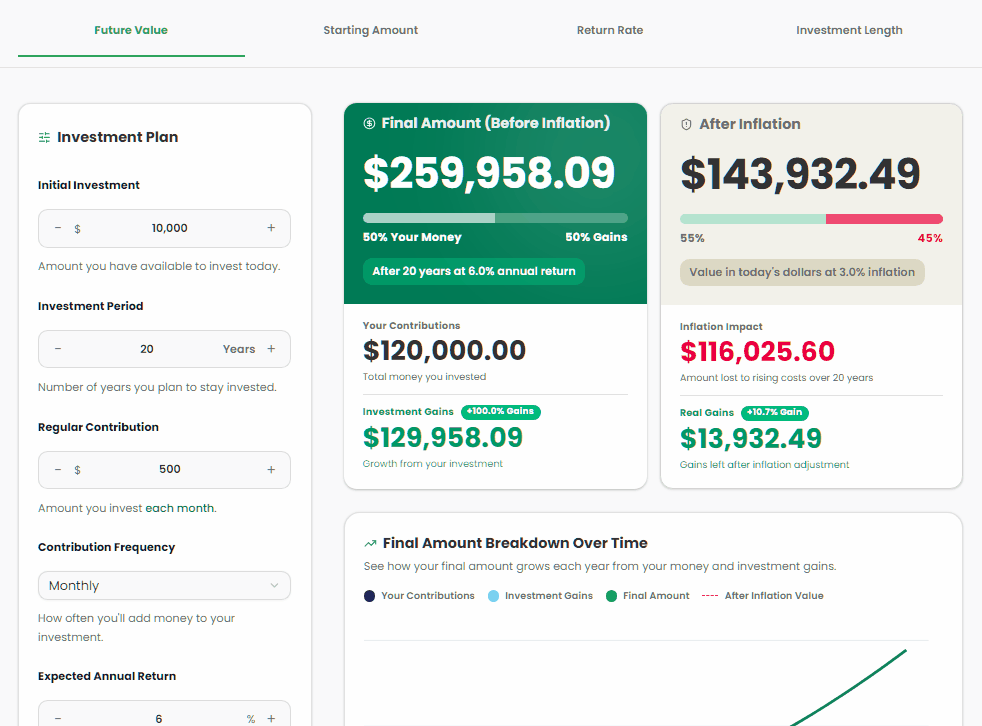
Switch between Future Value, Starting Amount, Return Rate, and Investment Length to answer different planning questions.
Use it like a rate of return calculator or annual return calculator to test what return might be needed, with historical S&P 500 context shown for reference.
Model monthly contributions (and other schedules) to compare savings versus market gains over time.
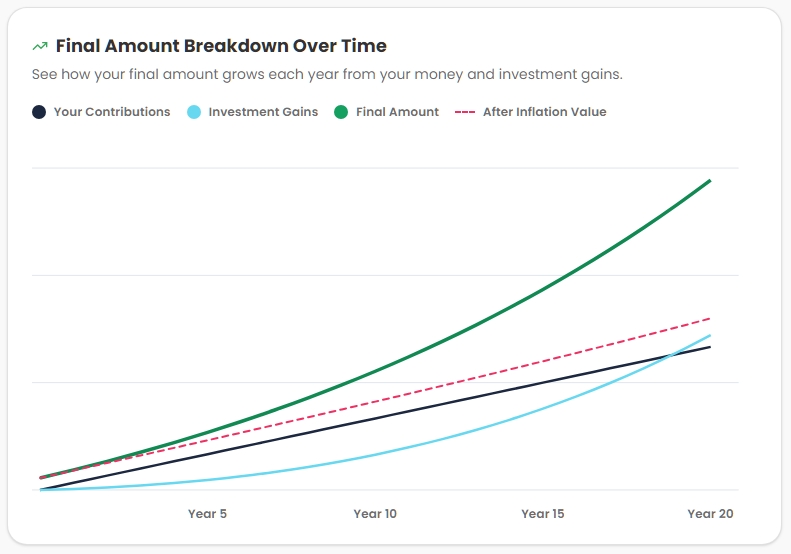
See a growth chart and a year-by-year table, so this investment over time calculator is easy to audit and explain.
Model a long-term index-fund scenario with assumptions you can review and change.
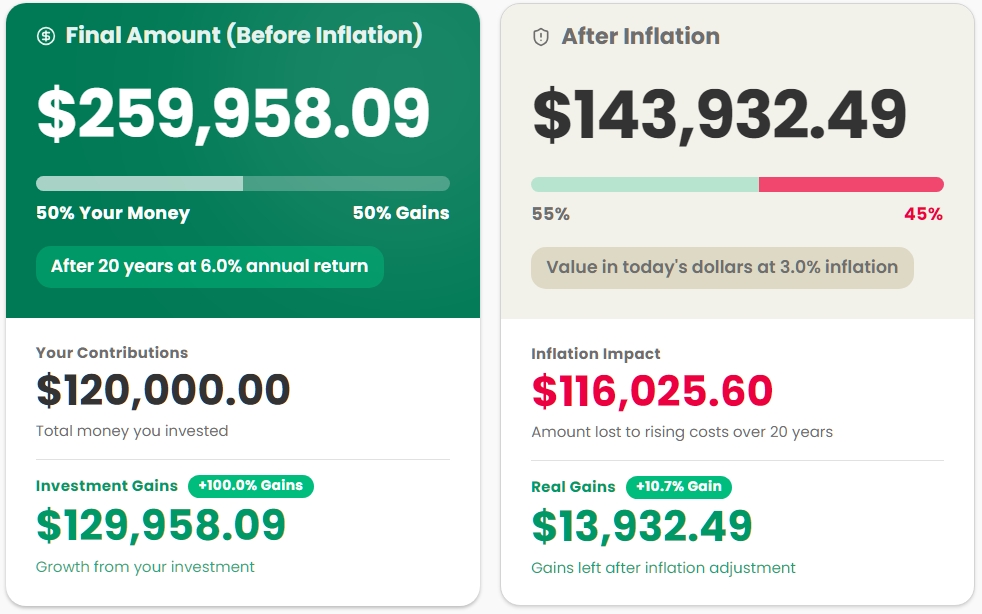
Add inflation to compare nominal growth with estimated purchasing power.
After you calculate, the URL captures your inputs so you can share the same scenario.
Built to keep inputs, charts, and the year-by-year table usable on smaller screens.
How to Use the Calculator
Three steps to model your investment scenario
Select Your Goal
Choose what you want to calculate:
- Future Value: Project your ending balance
- Required Initial Investment: Find how much to start with
- Needed Return Rate: Determine what annual return you'd need
- Time to Goal: Estimate years to reach your target
Enter Your Assumptions
Customize your scenario:
- Initial investment and target amount
- Recurring contribution and frequency
- Your expected annual return assumption
- Investment timeline (years)
- Inflation adjustment (optional): use 2%-3% for a simple real-return view, or 0% for nominal results
Analyze Results
Review detailed projections:
- Total contributions vs. investment gains to see where growth comes from
- Interactive growth chart to view trends over time
- Year-by-year breakdown to compare scenarios quickly
S&P 500 Calculator FAQs
Understanding the calculator and its assumptions
What does this S&P 500 calculator do?
It projects potential portfolio growth based on your inputs, initial investment, recurring contributions, expected returns, and time horizon. It's designed for long-term index fund investors who want to model different scenarios before investing.
Can I model different return scenarios?
Yes. Enter different annual return assumptions to compare how they affect the result. The Yahoo Finance ^GSPC reference shown in the calculator is price return data and does not include dividends.
How accurate are these projections?
This calculator uses compound interest math, which is precise for the assumptions you enter. However, actual market returns vary year to year. Use this for scenario planning, not as a prediction of future performance.
What's the difference between the calculation modes?
Future Value: "If I invest X per month for Y years, what might I have?" Starting Amount: "How much do I need to start with to reach my goal?" Return Rate: "What return would I need to reach my target?" Investment Length: "How long will it take to reach my goal?"
Should I include inflation?
Yes, for long-term planning. If you expect 10% returns, subtract ~2-3% for inflation to see "real" purchasing power growth. The calculator includes an optional inflation adjustment.
Can I use this for VOO, SPY, or other S&P 500 index funds?
Yes. Since VOO and SPY track the S&P 500, you can model their growth using this calculator. Just note that real returns will differ based on fees, tracking error, and dividend treatment. Adjust your expected return assumption to account for these factors (e.g., use 9.5% instead of 10% if the fund has a 0.5% fee).
Does it account for fees, taxes, dividends, or inflation?
Inflation adjustment is optional (you can set it in the calculator inputs). Fees and taxes are not automatically included, so adjust your expected return to account for them. For example, if you expect 10% nominal returns but pay 0.5% in fees and 2% inflation, use 7.5% as your input. Dividends are included only if your return assumption already reflects total return (price gains + dividends).
Can I see "what if I had invested $10,000 in the S&P 500" scenarios?
Yes. Set your starting amount to $10,000, recurring contributions to $0, choose the time period (e.g., 20 years), and enter the annual return assumption you want to test. The year-by-year table will show how the investment would grow under that assumption.
Can I save or share my results?
Yes. After running a calculation, you can copy the URL from your browser's address bar to share your scenario. Export to CSV/PDF is not currently available, but URL sharing allows you to bookmark and compare different scenarios.
Can I share or export results?
You can share the URL after you run the calculation. Exporting is not built in yet, but URL sharing still supports most portfolio return calculator comparisons.
Ready to Plan Your Portfolio?
Get year-by-year projections in under a minute. No signup required.